How are those charter schools doing?
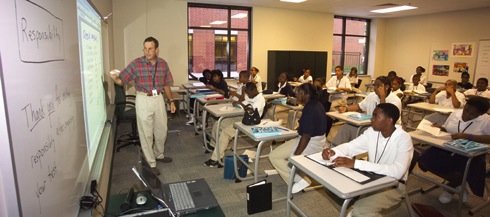
University Academy charter school in Kansas City
Charter schools seem to be all the rage today—among policy wonks, politicians like Mayor Francis Slay and libertarian think tanks. Unfortunately, here in St. Louis the results have not been encouraging for African-American parents.
Here are the 10 schools that had the lowest percentage of black students scoring proficient or advanced (+growth) on the communications portion of the 2008 MAP. The number of students is the number of black students reportable, which I included to show size.
| # students | Prof/Adv + Growth | |
IMAGINE REN ACAD ENV SCI & MA | 251.00 | 21.50 |
IMAGINE ACADEMY ES AND MATH | 325.00 | 19.10 |
B. BANNEKER ACADEMY | 119.00 | 16.80 |
URBAN COM. LEADERSHIP ACADEMY | 120.00 | 16.70 |
IMAGINE ACAD. ACADEMIC SUCCESS | 197.00 | 16.20 |
IMAGINE ACADEMY OF CAREERS | 324.00 | 14.80 |
GENESIS SCHOOL INC. | 67.00 | 13.40 |
CONSTRUCTION CAREERS CENTER | 40.00 | 10.00 |
HOGAN PREPARATORY ACADEMY | 54.00 | 3.70 |
DON BOSCO EDUCATION CTR. | 46.00 | 0.00 |
What do all 10 schools have in common? They are all charter schools and all test below Wellston, a St. Louis County district which lost accreditation (24.4). They also test well below the SLPS at 31.4.
To be fair, there are some successful charter schools. Academie Lafayette in Kansas City boasts the third highest rate in the state at 66.3. It’s a French Immersion school. Another charter that is doing well is University Academy, a college prep charter school in Kansas City (49.7).
Confluence Academies in St. Louis came in at 38.4, St. Louis Charter School at 35.2, Paideia at 27.4 and Lift for Life at 26.9. The county schools ranged from upper 30s to 50 with Fox at a much higher 71.4, tied for highest in the state. (Worthy of further research!)
While I like the concept of charter schools, I think some tightening up of supervision needs to happen in order to get state funds.
Should teachers go to school?
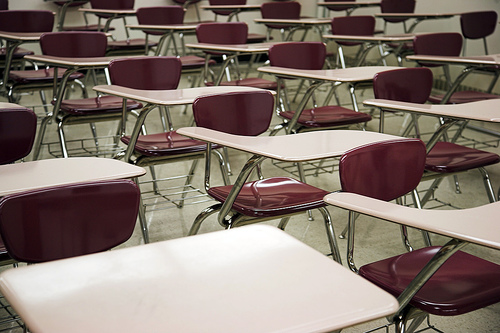 (photo by dcJohn)
 Ladue teachers are going back to school.
❝Ladue, one of the top-performing districts in the state, has recently told its teachers with bachelor's degrees that a master's degree "will be the new standard expected" within four years.❞ (St. Louis Post-Dispatch)
The Post article basically says that the teachers aren’t going back to improve their teaching, as “study after study” shows that further education isn’t worth much. Then why would Ladue encourage their teachers to spend their time in class?
❝To the Ladue School District, it's worth their reputation, and the support of voters who may approve or deny tax increases.❞
That seems harsh. Maybe pragmatic?
I had noticed the Ladue outlier in a post on teacher salaries last spring.
I would like to drill deeper into the research on graduate studies since it seems so counter-intuitive to me as both a former teacher and as someone who has looked at a lot of numbers. I have a lot of questions.
Would the research differ if we factored in the type of degree and/or the challenge level?
❝I still see a lot of generalist master's programs that are pretty easy and painless for teachers to get through," Hausfather [dean of education at Maryville University] said. "It's still hard to push programs that push people. They just want to get a degree and a pay raise.❞ (St. Louis Post-Dispatch)
❝They [Goldhaber and Brewer (1996) also found that, although advanced degrees in general were not associated with higher student achievement, an advanced degree that was specific to the subject area that a teacher taught was associated with higher achievement.❞ (Center for Public Education)
Would the research differ if we isolated certain age levels or certain subject areas?
❝Goldhaber and Brewer (1996) found that the presence of teachers with at least a major in their subject area was the most reliable predictor of student achievement scores in math and science.❞ (Center for Public Education)
What long-term effects does being perceived as more professional have on the teaching profession?
This seems to be the affect Ladue is going for. I’m not sure how it can be measured. Have they done surveys?
MAP scores highlight U.S. inequality
I am intrigued by the newly released Mo. MAP scores in a similar way to my fascination with political polling, complete with a need to understand the caveats and to dig deeper.
Fareed Zakaria, in The Post-American World, explains the U.S. math score mediocrity.
❝But even if the U.S. scores in math and science fall well below leaders like Singapore and Hong Kong, the aggregate scores hide deep regional, racial, and socioeconomic variation. [...] The difference between average science scores in poor and wealthy school districts within the United States, for instance, is four to five times greater than the difference between the U.S. and Singaporean national averages. In other words, America is a large and diverse country with a real inequality problem.❞
This inquality is highlighted in the St. Louis County MAP scores. The 10th grade math scores ranged from 81.4 percent of a school scoring proficient or advanced at Clayton to 0 at Wellston.
OK, that is pretty extreme. The top five scoring districts averaged 71.6 prof/adv.; while the bottom five districts (excluding Wellston) averaged 15.6. I excluded Wellston because it has had its accreditation stripped and students may go elsewhere. In fact several go to Clayton.
The elementary math numbers aren’t any better. I chose 5th grade because I felt that gave students several years to get used to testing. The top five districts averaged 75.02 prof/adv; whereas, the bottom five averaged 18.76.