Missouri top schools in math

Photo by Fábio Pinheiro
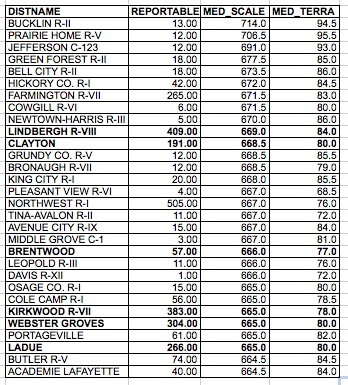
As part of my mission to widen the focus from St. Louis area to at least the state, I looked at the top school districts in Missouri in math in fourth grade and tenth grade. I chose fourth grade to give students the first year of testing to get used to taking standardized exams. I chose tenth grade as the highest grade of testing to look at the overall or “final” results of the district’s teaching. I looked at the median scale score instead of the number of proficient and advanced as I felt it was more representative of the spectrum of abilities including the advanced students. Also, this would discourage districts from overfocusing on the “bubble” students and, instead, work with each one equally. The median is more representative than mean as it is less affected by a student who fills in bubbles in cute patterns or one or two 0 scores. Many of the top school districts have grade levels that are quite small, so I included the numbers for perspective. I also included the median Terra Nova score to provide some national comparison and a frame of reference for the MAP scale score.
Missouri top 30 school districts 4th grade math
Missouri top 40 school districts 10th grade math
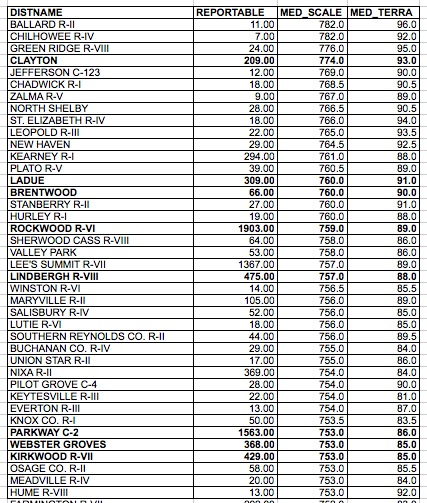
I dipped down to the top 40 (41) instead of the top 30 for the 10th grade math to pick up three more St. Louis County school districts.
To me it’s clear that while St. Louis County schools are strong, they have some competition in the state that should be acknowledged.
MAP student reports give parents LESS information
Photo by flag75*
If giving parents more information is the national trend, Missouri is going in the wrong direction. This year’s MAP student report (pdf) given to parents provides less information than before (pdf). Previously, parents were given the number of points possible and the percent of points earned for each subsection, which were related to the standards. That way they could see their child’s strengths and weaknesses within a content area.
This year parents are given the total score, no subtest break-outs.
As a parent I like that my child is also given a TerraNova score as it is nationally normed. Most parents I know prefer normed scores rather than standards based scores because it provides them with a frame of reference. (I have yet to meet a parent that actually likes standard-based report cards since they appear pretty meaningless to us.) How hard is it to get into the advanced category? proficient?
Speaking of frame of reference, the other piece of information given, the Lexile score, is completely lacking that for most parents. What does it mean? Oh, we’re told to go look it up. In the past parents were provided some information on the score, but not this year. Now it’s just see the website and talk to your local librarian.
❝The score measures the reading skill level of your child, so you may choose books that will encourage reading progress at www.Lexle.com. Here you will find a list of titles withn your child’s Lexile range. Your local/school librarian can also help you find books within your child’s Lexile range.❞
I’m an informed parent, and I had to find a conversion chart.
Parents want information, but I’m afraid educrats are too used to seeing these results and don’t know how to provide them in a helpful manner and manage to both under and overestimate parents at the same time.
So while educators, policy wonks and social scientists debate the validity of various assessment measurement methods (which I’ll follow with interest), I would like the state to improve its communication to the parents. Perhaps it should start by having some parents help out.
Hospitals, school districts benefit from open data
Driving home the other day I heard a discussion on NPR Talk of the Nation about putting hospital statistics online so people can compare them. I immediately thought that if one substituted the word schools for hospitals the discussion would be the same.
Challenges of comparing high-risk patients to low-risk patients. Check.
Hospitals not being eager to provide data. Check.
Benefits of openness and transparency. Check.
Need to put checks in to prevent hospitals from gaming the system. Check.
The show concluded by the experts agreeing that this is an important but still small first step in accountability, openness and transparency. The biggest benefit comes not from patients being able to compare hospitals but from hospitals sending staff to high-scoring ones to learn from them.
In that spirit, if I were a superintendent in the St. Louis metropolitan area, I would send someone to Fox to find out why they have the highest percentage of free and reduced lunch students in the St. Louis area scoring at proficient or advanced in both math and communications MAP scores.
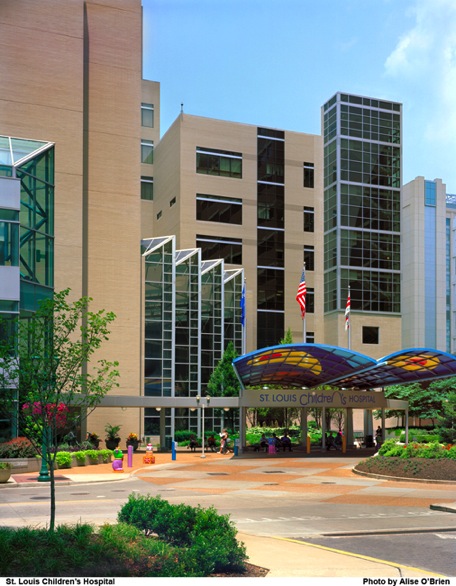
I chose this picture because I liked it and Children’s is, unfortunately, the hospital I have used the most often as I have three children. The website focuses on acute care and doesn’t include pediatric hospitals like Children’s or Cardinal Glennon even though it has a section for children’s asthma.
How are those charter schools doing?

University Academy charter school in Kansas City
Charter schools seem to be all the rage today—among policy wonks, politicians like Mayor Francis Slay and libertarian think tanks. Unfortunately, here in St. Louis the results have not been encouraging for African-American parents.
Here are the 10 schools that had the lowest percentage of black students scoring proficient or advanced (+growth) on the communications portion of the 2008 MAP. The number of students is the number of black students reportable, which I included to show size.
| # students | Prof/Adv + Growth | |
IMAGINE REN ACAD ENV SCI & MA | 251.00 | 21.50 |
IMAGINE ACADEMY ES AND MATH | 325.00 | 19.10 |
B. BANNEKER ACADEMY | 119.00 | 16.80 |
URBAN COM. LEADERSHIP ACADEMY | 120.00 | 16.70 |
IMAGINE ACAD. ACADEMIC SUCCESS | 197.00 | 16.20 |
IMAGINE ACADEMY OF CAREERS | 324.00 | 14.80 |
GENESIS SCHOOL INC. | 67.00 | 13.40 |
CONSTRUCTION CAREERS CENTER | 40.00 | 10.00 |
HOGAN PREPARATORY ACADEMY | 54.00 | 3.70 |
DON BOSCO EDUCATION CTR. | 46.00 | 0.00 |
What do all 10 schools have in common? They are all charter schools and all test below Wellston, a St. Louis County district which lost accreditation (24.4). They also test well below the SLPS at 31.4.
To be fair, there are some successful charter schools. Academie Lafayette in Kansas City boasts the third highest rate in the state at 66.3. It’s a French Immersion school. Another charter that is doing well is University Academy, a college prep charter school in Kansas City (49.7).
Confluence Academies in St. Louis came in at 38.4, St. Louis Charter School at 35.2, Paideia at 27.4 and Lift for Life at 26.9. The county schools ranged from upper 30s to 50 with Fox at a much higher 71.4, tied for highest in the state. (Worthy of further research!)
While I like the concept of charter schools, I think some tightening up of supervision needs to happen in order to get state funds.
MAP scores highlight U.S. inequality
I am intrigued by the newly released Mo. MAP scores in a similar way to my fascination with political polling, complete with a need to understand the caveats and to dig deeper.
Fareed Zakaria, in The Post-American World, explains the U.S. math score mediocrity.
❝But even if the U.S. scores in math and science fall well below leaders like Singapore and Hong Kong, the aggregate scores hide deep regional, racial, and socioeconomic variation. [...] The difference between average science scores in poor and wealthy school districts within the United States, for instance, is four to five times greater than the difference between the U.S. and Singaporean national averages. In other words, America is a large and diverse country with a real inequality problem.❞
This inquality is highlighted in the St. Louis County MAP scores. The 10th grade math scores ranged from 81.4 percent of a school scoring proficient or advanced at Clayton to 0 at Wellston.
OK, that is pretty extreme. The top five scoring districts averaged 71.6 prof/adv.; while the bottom five districts (excluding Wellston) averaged 15.6. I excluded Wellston because it has had its accreditation stripped and students may go elsewhere. In fact several go to Clayton.
The elementary math numbers aren’t any better. I chose 5th grade because I felt that gave students several years to get used to testing. The top five districts averaged 75.02 prof/adv; whereas, the bottom five averaged 18.76.
Missouri students write for their state assessment too!

Debbie Monterrey and Doug McElvein of KMOX's Total Information AM interviewed (audio download) Thomas Toch of Education Sector this morning about NCLB, focusing on how the tests differ between states. Yes, states construct their own tests of varying difficulty levels.
I thought it ironic, and showing of poor prep all around, that the state everyone kept referring to as one that uses open-ended questions, you know, actually having the kids write, was Massachusetts. True, Massachusetts has challenging tests, but, hey! Missouri does too! The kids complete short answer questions in addition to a writing prompt. The local angle and all that.
MAP practice tests
IES Research and Development Report
Mapping 2005 State Proficiency Standards onto the NAEP Scales
(MO not included in Reading)
4th grade math
Mo 5th highest and close to the NAEP proficient cut score (242)
8th grade math
Mo highest score and well above the NAEP proficient cut score (311)
Rant over, back to your regularly scheduled programming.
It's Report Card time!
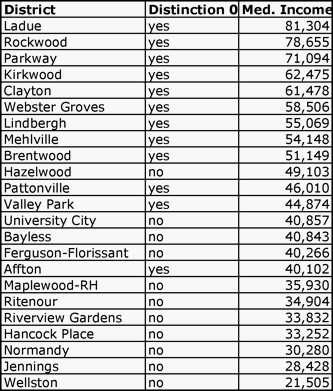
I am sure I will be mining these report cards for data for some time, but for today's sneak preview I thought I would provide a chart listing the St. Louis county districts by median income and then whether or not they met the criteria for this "award." It's quite telling I think.