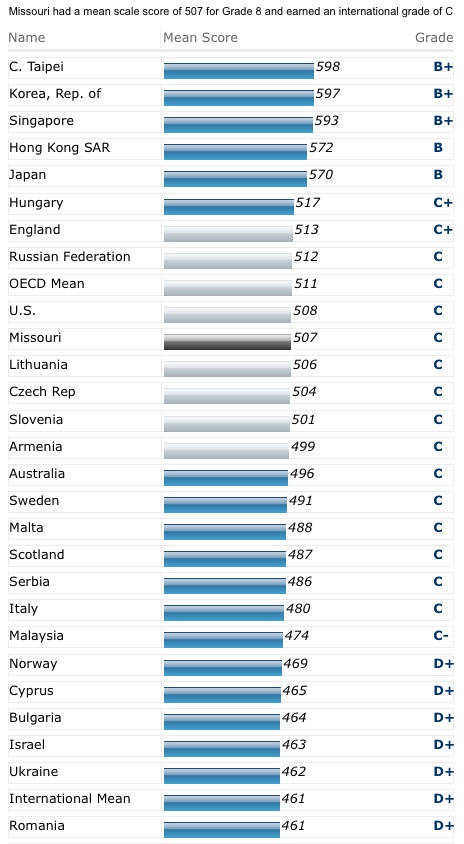
Missouri beats Lithuania by one—in math

photo by apesara
Last fall, I blogged about the importance of comparing our students not just to other students locally or to other states but internationally. Ideally, we would have information for individual districts, but until we do, the American Institutes for Research has released a report that allows you to compare individual states with other countries. Missouri, not surprisingly, is right at the U.S. median for both fourth and eighth grade math scores.
At the fourth grade level only six states received a B; by eighth grade only Massachusetts received a B.
“These Asian nations consistently perform at the B+, B, and B- levels,” Phillips [acting commissioner of the National Center for Education Statistics from 1999 to 2002] said. “Their students are learning mathematics not just at a higher level than students in the United States, but at a level that is a quantum leap higher.” The math proficiency average for U.S. students is C+ in grade 4 and C at grade 8. (AIR news release 16 June 2009)
Since Missouri is right behind the U.S. average, we are not competing well against Asian students.
“Our states and school districts should no longer be comparing themselves to their neighbors. They will be competing for jobs and innovations with students around the globe.” (AIR news release 16 June 2009)
I’ve said that before.
our states and school districts fall comparatively further behind in Grade 8 than they do in Grade 4. Although the United States falls further behind in the higher grade, the highest achieving countries maintain their level of performance. AIRInternationalBenchmarks2009
The middle school problem is real in the United States and, apparently, Missouri also. As a culture we are more concerned about their social lives than their academic abilities. Our expectations are not high-- “They can’t think clearly with all those hormones!” --but they obviously work hard in other countries. I would love to see if any of our middle schools are bucking this trend.
Here is the chart showing where Missouri places compared to other countries for eighth grade math. The grey bars are for countries with scores that are considered statistically similar. The interactive chart is fascinating to play with. I eagerly await the time when we can put individual school districts in for comparison.
Nixon needs to act on standards, now!
Missouri is one of only four states to not have the governor sign on to work together to create a set of voluntary national standards. Texas, Alaska and South Carolina are the other three--conservative governors with presidential aspirations is the common denominator among them.
Why didn’t Gov. Jay Nixon sign on for Missouri? presumably because we are currently without a commissioner. However, since this was an association of governors, Nixon has the authority, the responsibility to lead the state. He doesn’t have to wait until a new commissioner is hired.
But the state doesn’t have that much time. Panels are working on suggested standards set to come out in July.The president of Missouri's board of education said he, too, expected his members to revisit the issue soon."I think we'll seriously consider it over the next several months," said state board President Russell Thompson. "Once we're assured Missouri can have higher standards." (Missouri Balks, St. Louis Post-Dispatch)
Later, a separate national "validation" panel, made of up of experts nominated by the states, will review the proposal. (46 States, Washington Post)
If we wait too long, we won’t have a chance to review the proposal. We have to make that deadline.
Some (such as Caitlin Hartsell for Show-Me Institute) say we don’t need to join the common standards movement because Missouri already has high standards.
And, as it is, fewer than half of Missouri’s students are meeting or exceeding the MAP standards Adopting lower national standards instead would only provide a misleading inflation of achievement metrics.
But this is mixing up the challenge level of the MAP, which is high, with the Missouri standards, which are not. In fact the math standards are under review, which is being extended because of disagreement with the draft standards.
The math wars are nothing new, but the rigor of the Mo. standards is not high, is confusing and contains jargon.Members of prominent university mathematics departments in Missouri are calling for an evaluation of state standards and expectations in K-12 math curriculum. (Math Professors, Columbia Missourian)
For example, for fourth grade, the proposed standard is broken into Core Concept, Learning Goal and Performance Indicator. (Ed. to add--I chose this somewhat randomly. I’m familiar with 4th grade, and fractions are difficult and important. I did not pick and choose.)
Grade 4, Core Concept B--Develop understanding of decimals, including the connections between fractions and decimals.2) Understand relationships among whole numbers, commonly used fractions, and decimals.
- Model fractions (halves, fifths fourths, eighths, and tenths) on a 10 x 10 grid representing one unit in order to convert fractions to decimals.
- Rename whole numbers as fractions with different denominators (e.g., 5 = 5/1, 3 = 6/2, 1 = 7/7), with or without models.
- Relate fractions with denominators of tenths and hundredths to decimals of equivalent values.
- Identify equivalent fractions and decimals (less than one, equivalent to one, and greater than one), with and without models, including locations on a number line.
- Use a variety of methods to compare and order decimals and fractions.
Compare this to a similar California standard:
Number Sense
1.0 Students understand the place value of whole numbers and decimals to two decimal places and how whole numbers and decimals relate to simple fractions. Students use the concepts of negative numbers:
1.1 Read and write whole numbers in the millions.
1.2 Order and compare whole numbers and decimals to two decimal places.
1.3 Round whole numbers through the millions to the nearest ten, hundred, thousand, ten thousand, or hundred thousand.
1.4 Decide when a rounded solution is called for and explain why such a solution may be appropriate.
1.5 Explain different interpretations of fractions, for example, parts of a whole, parts of a set, and division of whole numbers by whole numbers; explain equivalents of fractions (see Standard 4.0).
1.6 Write tenths and hundredths in decimal and fraction notations and know the fraction and decimal equivalents for halves and fourths (e.g., 1⁄2 = 0.5 or .50; 7⁄4 = 1 3⁄4 = 1.75).
1.7 Write the fraction represented by a drawing of parts of a figure; represent a given fraction by using drawings; and relate a fraction to a simple decimal on a number line.
mathstandard
As a state with a difficult assessment, I think we’ll benefit from a common standard. We won’t look bad when compared to states with easy assessments when they upgrade their tests. We won’t need to “dumb down” ours; instead, the rest of the country will need to catch up to our assessments. In fact, our standards need to catch up to our assessments.
Agreeing to work to create the common standards is not the same as agreeing to follow and change the MAP to assess by the common standards. This first step is a no-brainer. I’ll wait until the actual standards come out to make a decision on the next, but with our transient population that needs to meet international standards I applaud the effort and strongly encourage Gov. Nixon to sign on today. Otherwise, we’re likely to be looking at standards we did not have a role in helping to create.
Best high schools list out
The perennial Newsweek best high school list compiled by Jay Mathews is out again. Valid criticisms of the list may be made, but the criteria is clear, is easy to understand and has changed the education landscape.
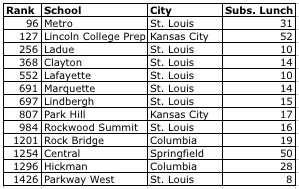
Only 13 schools from Missouri made the list, but at least that is up one from last year. In St. Louis Eureka dropped off the list, but Parkway West made it.
Kansas City only has one non-selective school on the list versus seven for St. Louis. There are, however, four high schools on the list on the Kansas City, Kansas side. Both high schools in Columbia made the list, which is impressive. The Springfield high school with 50 percent on subsidized lunch that made the list is not, as far as I can tell, selective. I believe that is the high school closest to the university, which may skew the subsidized lunch demographics, but those numbers are still impressive.
In 2005 St. Louis schools dominated the 10 schools from Missouri that made the list with only Lincoln College Prep, Hickman in Columbia and Park Hill in Kansas City rounding out the list. Lafayette in St. Joseph made the list in 2006, which would be nice to see return.
I think the geographical map of the top 1300 schools is interesting with a sea of blue on the coasts and in Florida.
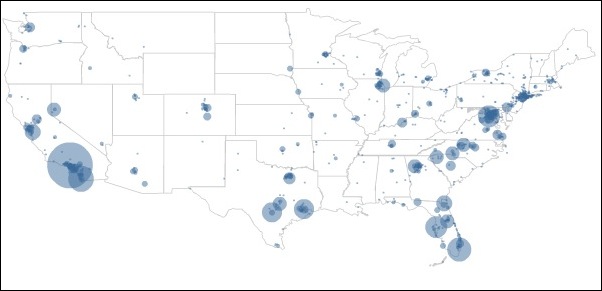
I zoomed in on Missouri and the surrounding states, which show blue in the urban areas with some pinpricks in some college towns.
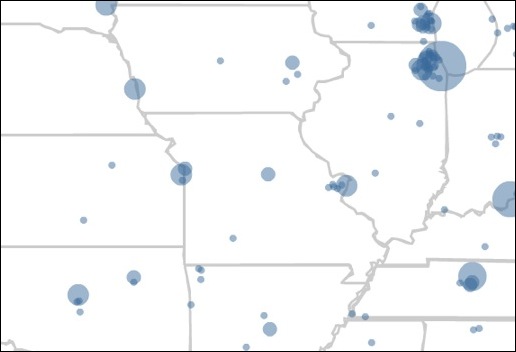
With Missouri Virtual Instruction Program offering AP courses (pdf), students in rural schools now have more opportunities to take advanced classes. I would like to see more rural schools make the list.
Schools have to continually increase the percentage of students taking AP/IB exams just to stay on the list. For example, Ladue improved its index number from last year but dropped in rank. This is meant to be a “race to the top,” where the top means access to challenging courses for as many students as possible.
A new, non-researched phenomenom has begun in which some schools are all-out embracing the AP courses as a challenge for struggling students in coursework that doesn’t require prerequisites.
The rise of high-participation, low-passing-rate AP schools like Bell and Hogan has led NEWSWEEK this year to put them in a separate category, the Catching-Up list, for schools that have met the NEWSWEEK standard for college-level test participation but have AP passing rates below 10 percent. Once such schools pass the 10 percent passing mark, they will have about the same number of passing tests as the average American school, where passing rates are higher but participation is much lower. (AP Programs as Educational Shock Therapy)
Two high schools in Kansas City are using this approach. We’ll watch to see how they do next year.
Missouri ranges from 10 to 13 schools on the last from year to year. Next year, I would like to see that change and blown away.
Ode to the MAP
Photo by Marxchivist
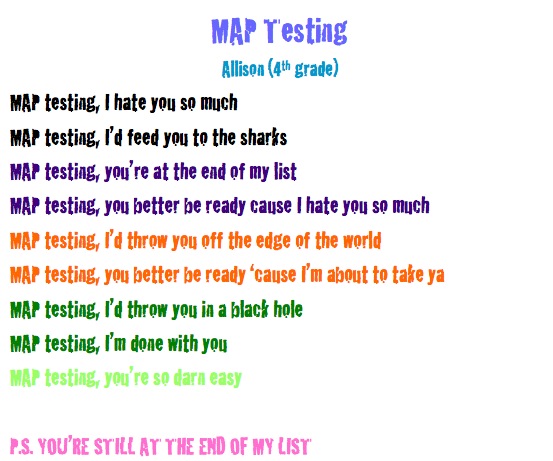
While some schools went to extravagant lengths to pump up their students for Missouri’s standardized test, the MAP, others were more low-key.
My daughter’s teacher showed the students a constructive method for expressing their anxieties and other feelings about taking the test by having them write a poem about the MAP to include in their poetry unit. My daughter’s poem included below with permission was inspired by Jack Prelutsky’s Homework! Oh, Homework!
Stay in school!
Today the Everyone Graduates Center issued a report (pdf) on graduation rates. Missouri was one of the states going against the trend and improving its rates. Yeah! While we didn’t make as great of gains as states like Tenn., we weren’t as far behind to start with either, so I would rather be in our position. In fact we are one of the states with the higher graduation rates. Iowa, Minnesota, Nebraska and Wisconsin have the highest graduation rates.
As Missouri increases its graduation requirements, which go into effect for the class of 2010 (e.g. 3 math courses instead of 2 and 24 credits instead of 22), I wonder how that will affect the graduation rates. States such as Alabama improved grad rates while tightening standards, so it can be done.
Defining graduation rates seems to be a problem as various states have traditionally defined it differently. In fact the percent for Missouri given in the report mentioned earlier is different (and lower) than the percent given on the DESE website. Just trying to do some preliminary research is frustrating, to say the least.
Whatever the definition used, the city of St. Louis has decreasing graduation rates instead of improving (62 percent in 2004 to 49.8 in 2008). Because of the sheer size of the district, helping the city with its problem helps the state.
Missouri top schools in math

Photo by Fábio Pinheiro
As part of my mission to widen the focus from St. Louis area to at least the state, I looked at the top school districts in Missouri in math in fourth grade and tenth grade. I chose fourth grade to give students the first year of testing to get used to taking standardized exams. I chose tenth grade as the highest grade of testing to look at the overall or “final” results of the district’s teaching. I looked at the median scale score instead of the number of proficient and advanced as I felt it was more representative of the spectrum of abilities including the advanced students. Also, this would discourage districts from overfocusing on the “bubble” students and, instead, work with each one equally. The median is more representative than mean as it is less affected by a student who fills in bubbles in cute patterns or one or two 0 scores. Many of the top school districts have grade levels that are quite small, so I included the numbers for perspective. I also included the median Terra Nova score to provide some national comparison and a frame of reference for the MAP scale score.
Missouri top 30 school districts 4th grade math
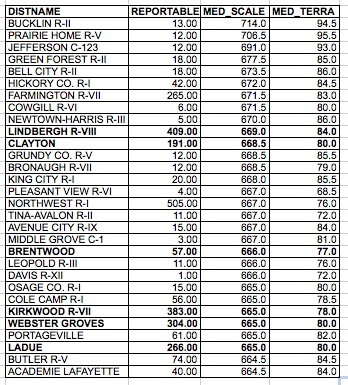
Missouri top 40 school districts 10th grade math
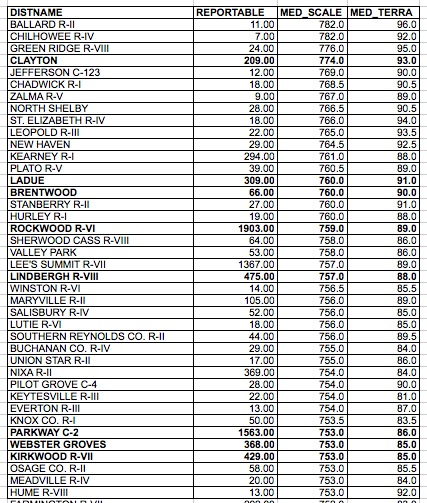
I dipped down to the top 40 (41) instead of the top 30 for the 10th grade math to pick up three more St. Louis County school districts.
To me it’s clear that while St. Louis County schools are strong, they have some competition in the state that should be acknowledged.
What about the students outside St. Louis?

Photo by Hira3
Local school districts like to tout their rankings in MAP scores as a way to demonstrate quality. “We’re #1 in St. Louis in this particular grade in a math scores at this elementary school. Yay us!” While districts do have some reasons to compare themselves to other districts within the metropolitan area, they do need to realize the limitations.
After listening to a district list its MAP score rankings within St. Louis at a parent meeting, a friend complained to me about the “provincial” thinking. “These kids compete for college with students across the country, not just from St. Louis.” Friends of mine who are from other cities don’t understand our emphasis on competing against only local schools.
I’ll start by trying to focus less on St. Louis-only comparisons and incude more state comparisons when discussing MAP scores. I’ll also try to compare across state lines and international when possible. If I want districts to broaden their outlook, I should start by doing so here.
Science: What gets tested gets taught

Photo by Adam Baker
Since the MAP is including science now, schools are increasing their focus on teaching science although I’m not sure they have enough.
All of this comes as economic and education experts worry about U.S. global competitiveness.
“We should be embarking immediately on an all-hands-on-deck, no-holds-barred, no budget-too-large crash program for science and engineering education.” (Thomas L. Friedman in The World is Flat 3.0)
Missouri needs to increase its state requirements for graduation. All students need to take biology, chemistry and physics (not necessarily in that order). Students graduating in 2010 are required to take three years (same as math and history), which is an increase from the currently required two years. I think all students should take four years of all four core subjects. Most schools don’t require physics, but the concepts are essential in science and can be taught to all. (See previous post on teaching physics first.)
For example, Hazelwood currently requires students to take Physical Systems and Chemical Systems, each a semester course. Then students are required to take biology for a year. This includes students with a College Prep designation on their diploma. With the requirement increase, students are then required to add another year of science of their choice. Only one semester of chemistry? They offer a full year of chemistry but don’t require it. This is not enough science for people competing with other countries for jobs and deciding on the direction of science via elections.
Francis Howell currently requires a year of physical science and a year of biology. Chemistry and physics are optional.
Elementary schools need to increase the emphasis on science and integrate science with math and reading.
MRH, which has a helpful curriculum online, does not include science K-5. Is it not important enough?
Rockwood does include a grade-by-grade detailed list of its science curriculum starting at the K level. It also puts on a Science Expo at the beginning of the year to stir up excitement and let the students and parents know of science resources available in St. Louis.
Mehlville doesn’t include the detail that Rockwood does, but it gives an easy to decipher overview of the content covered in each grade, the name of the textbook used (!) and suggested resources and activities for families. As an educator I like the Rockwood detail, but the Mehlville overview is definitely more readable. I would like districts to include both.
I looked at the 2008 MAP 5th grade science scores comparing median MAP scale scores. None of the top 10 in the state were in the St. Louis metropolitan area, but none of them had more than 27 students taking the test, so I narrowed my list to districts in the metropolitan area, including charter schools. The top school districts were not surprising, but I was intrigued by some of the districts on the list such as Washington, Windsor and Fox. Parkway was 16th. Union and Festus were 11 and 12.
| DISTNAME | MEDIAN_SCALE_SCORE |
| ROCKWOOD R-VI | 684 |
| LADUE | 682 |
| KIRKWOOD R-VII | 680 |
| CLAYTON | 680 |
| LINDBERGH R-VIII | 677 |
| BRENTWOOD | 676 |
| WEBSTER GROVES | 676 |
| WINDSOR C-1 | 674 |
| FOX C-6 | 674 |
| WASHINGTON | 673 |
I then searched to see if the same districts had the highest number of students scoring at the advanced level.
| DISTNAME | ADVANCED_PCT |
| ROCKWOOD R-VI | 39.6 |
| LADUE | 36.2 |
| CLAYTON | 30.2 |
| KIRKWOOD R-VII | 28.9 |
| WEBSTER GROVES | 28.5 |
| LINDBERGH R-VIII | 25.4 |
| ORCHARD FARM R-V | 22.9 |
| WASHINGTON | 22.3 |
| FOX C-6 | 22.2 |
| JEFFERSON CO. R-VII | 20.2 |
Most of the districts were the same with Orchard Farm joining the list and Windsor falling to 11. Parkway moved up to 12.
Sorting by median Terra Nova scores shuffled the districts a bit bringing New Haven (Franklin Co. R-II) into the top.
| DISTNAME | MEDIAN_TERRANOVA |
| ROCKWOOD R-VI | 82.0 |
| CLAYTON | 81.0 |
| BRENTWOOD | 80.0 |
| KIRKWOOD R-VII | 79.0 |
| LADUE | 77.0 |
| FRANKLIN CO. R-II | 77.0 |
| WEBSTER GROVES | 76.0 |
| UNION R-XI | 74.0 |
| FOX C-6 | 73.5 |
| LINDBERGH R-VIII | 73.0 |
Rockwood comes out on top in every configuration. Whether it is the Science Expo, detailed expectations or another reason altogether, the elementary schools there come ahead.
I’ll be interested to watch whether this new focus on science raises everyone’s scores.
MAP student reports give parents LESS information
Photo by flag75*
If giving parents more information is the national trend, Missouri is going in the wrong direction. This year’s MAP student report (pdf) given to parents provides less information than before (pdf). Previously, parents were given the number of points possible and the percent of points earned for each subsection, which were related to the standards. That way they could see their child’s strengths and weaknesses within a content area.
This year parents are given the total score, no subtest break-outs.
As a parent I like that my child is also given a TerraNova score as it is nationally normed. Most parents I know prefer normed scores rather than standards based scores because it provides them with a frame of reference. (I have yet to meet a parent that actually likes standard-based report cards since they appear pretty meaningless to us.) How hard is it to get into the advanced category? proficient?
Speaking of frame of reference, the other piece of information given, the Lexile score, is completely lacking that for most parents. What does it mean? Oh, we’re told to go look it up. In the past parents were provided some information on the score, but not this year. Now it’s just see the website and talk to your local librarian.
❝The score measures the reading skill level of your child, so you may choose books that will encourage reading progress at www.Lexle.com. Here you will find a list of titles withn your child’s Lexile range. Your local/school librarian can also help you find books within your child’s Lexile range.❞
I’m an informed parent, and I had to find a conversion chart.
Parents want information, but I’m afraid educrats are too used to seeing these results and don’t know how to provide them in a helpful manner and manage to both under and overestimate parents at the same time.
So while educators, policy wonks and social scientists debate the validity of various assessment measurement methods (which I’ll follow with interest), I would like the state to improve its communication to the parents. Perhaps it should start by having some parents help out.
Hospitals, school districts benefit from open data

Driving home the other day I heard a discussion on NPR Talk of the Nation about putting hospital statistics online so people can compare them. I immediately thought that if one substituted the word schools for hospitals the discussion would be the same.
Challenges of comparing high-risk patients to low-risk patients. Check.
Hospitals not being eager to provide data. Check.
Benefits of openness and transparency. Check.
Need to put checks in to prevent hospitals from gaming the system. Check.
The show concluded by the experts agreeing that this is an important but still small first step in accountability, openness and transparency. The biggest benefit comes not from patients being able to compare hospitals but from hospitals sending staff to high-scoring ones to learn from them.
In that spirit, if I were a superintendent in the St. Louis metropolitan area, I would send someone to Fox to find out why they have the highest percentage of free and reduced lunch students in the St. Louis area scoring at proficient or advanced in both math and communications MAP scores.
I chose this picture because I liked it and Children’s is, unfortunately, the hospital I have used the most often as I have three children. The website focuses on acute care and doesn’t include pediatric hospitals like Children’s or Cardinal Glennon even though it has a section for children’s asthma.
How are those charter schools doing?
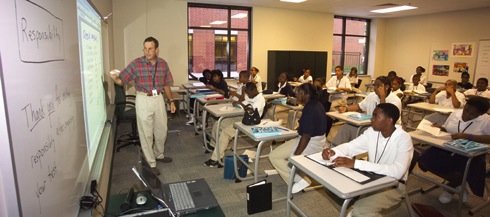
University Academy charter school in Kansas City
Charter schools seem to be all the rage today—among policy wonks, politicians like Mayor Francis Slay and libertarian think tanks. Unfortunately, here in St. Louis the results have not been encouraging for African-American parents.
Here are the 10 schools that had the lowest percentage of black students scoring proficient or advanced (+growth) on the communications portion of the 2008 MAP. The number of students is the number of black students reportable, which I included to show size.
| # students | Prof/Adv + Growth | |
IMAGINE REN ACAD ENV SCI & MA | 251.00 | 21.50 |
IMAGINE ACADEMY ES AND MATH | 325.00 | 19.10 |
B. BANNEKER ACADEMY | 119.00 | 16.80 |
URBAN COM. LEADERSHIP ACADEMY | 120.00 | 16.70 |
IMAGINE ACAD. ACADEMIC SUCCESS | 197.00 | 16.20 |
IMAGINE ACADEMY OF CAREERS | 324.00 | 14.80 |
GENESIS SCHOOL INC. | 67.00 | 13.40 |
CONSTRUCTION CAREERS CENTER | 40.00 | 10.00 |
HOGAN PREPARATORY ACADEMY | 54.00 | 3.70 |
DON BOSCO EDUCATION CTR. | 46.00 | 0.00 |
What do all 10 schools have in common? They are all charter schools and all test below Wellston, a St. Louis County district which lost accreditation (24.4). They also test well below the SLPS at 31.4.
To be fair, there are some successful charter schools. Academie Lafayette in Kansas City boasts the third highest rate in the state at 66.3. It’s a French Immersion school. Another charter that is doing well is University Academy, a college prep charter school in Kansas City (49.7).
Confluence Academies in St. Louis came in at 38.4, St. Louis Charter School at 35.2, Paideia at 27.4 and Lift for Life at 26.9. The county schools ranged from upper 30s to 50 with Fox at a much higher 71.4, tied for highest in the state. (Worthy of further research!)
While I like the concept of charter schools, I think some tightening up of supervision needs to happen in order to get state funds.
MAP scores highlight U.S. inequality
I am intrigued by the newly released Mo. MAP scores in a similar way to my fascination with political polling, complete with a need to understand the caveats and to dig deeper.
Fareed Zakaria, in The Post-American World, explains the U.S. math score mediocrity.
❝But even if the U.S. scores in math and science fall well below leaders like Singapore and Hong Kong, the aggregate scores hide deep regional, racial, and socioeconomic variation. [...] The difference between average science scores in poor and wealthy school districts within the United States, for instance, is four to five times greater than the difference between the U.S. and Singaporean national averages. In other words, America is a large and diverse country with a real inequality problem.❞
This inquality is highlighted in the St. Louis County MAP scores. The 10th grade math scores ranged from 81.4 percent of a school scoring proficient or advanced at Clayton to 0 at Wellston.
OK, that is pretty extreme. The top five scoring districts averaged 71.6 prof/adv.; while the bottom five districts (excluding Wellston) averaged 15.6. I excluded Wellston because it has had its accreditation stripped and students may go elsewhere. In fact several go to Clayton.
The elementary math numbers aren’t any better. I chose 5th grade because I felt that gave students several years to get used to testing. The top five districts averaged 75.02 prof/adv; whereas, the bottom five averaged 18.76.
Moneyball

I know that everyone on the East Coast is hyperfocusing on the Superbowl, which I'll watch, but, really, I'm just counting the days to spring training.
In fact, baseball and education are amazingly similar.
❝He [Joe Maddon, Tampa Bay] knows human factors affect the numbers radically. Context is partially external (in baseball, factors like ball park effects, weather, a humidor or not) but it's vastly internal (human players as individuals and as part of the team and their individual quirks and personal strengths and weaknesse
He knows the numbers only take you so far and that you have to go farther than that to achieve excellence. Maddon doesn't lose sight of the vast pool of non-numeric data out there...that goes into his pool from which to draw❞ (Management by Baseball)
Tony LaRussa, while not exactly a Moneyball proponent, gives a great quote.
❝The 'Moneyball' kind of stuff has its place, but so does the human," La Russa said by telephone from Pittsburgh. "Really, the combination is the answer.❞
As teachers, principals, administrators, researchers and policy wonks, we all need to remember that data can help us improve education without being so data-driven as to lose sight of good teaching.
Missouri students write for their state assessment too!

Debbie Monterrey and Doug McElvein of KMOX's Total Information AM interviewed (audio download) Thomas Toch of Education Sector this morning about NCLB, focusing on how the tests differ between states. Yes, states construct their own tests of varying difficulty levels.
I thought it ironic, and showing of poor prep all around, that the state everyone kept referring to as one that uses open-ended questions, you know, actually having the kids write, was Massachusetts. True, Massachusetts has challenging tests, but, hey! Missouri does too! The kids complete short answer questions in addition to a writing prompt. The local angle and all that.
MAP practice tests
IES Research and Development Report
Mapping 2005 State Proficiency Standards onto the NAEP Scales
(MO not included in Reading)
4th grade math
Mo 5th highest and close to the NAEP proficient cut score (242)
8th grade math
Mo highest score and well above the NAEP proficient cut score (311)
Rant over, back to your regularly scheduled programming.
Can data improve my teaching?

I did my first formal CAT yesterday. I've added a new assignment this semester (group wiki), so I asked them to write down strengths and areas to improve on the assignment. We then discussed it, and I told them my ideas for improvement also. I use this in conjunction with their final products to help me improve my teaching for next semester or possibly future assignments if applicable.
That is my background on assessment.
I've enjoyed reading Eduwonkette's week on data-driven posts and appreciated the link to Scott McLeod's data resource page where I found an article that made the parent side of me salivate.
❝Stage-three schools shift the focus from groups to individual students — every single, individual student.❞
McIntire discusses how schools can say that they focus on all students but most don't have the systems in place to do so. I've had friends whose districts say they differentiate, but they don't feel the district follows that mission statement at all.
Differentiating is the buzzword right now, but it is hard to implement without support.
❝In stage-three schools, school leaders establish structures of accountability that ensure teachers regularly analyze student performance data, talk about it in functional units, and enact specific action plans at the classroom, team, grade, and school level.❞
Of course to do that requires time for teachers to meet together in teams, which they should be doing anyway.
❝How can teachers hope to provide customized instruction to dozens or even hundreds of students?❞
But they can, and do. I've seen it.
Using data to improve instruction shouldn't be overrelied on but if used with commonsense can help more kids learn. Off to read Datawise now.
Data Mining

The Quality Counts 2008 Report is out, and Missouri didn't finish in the top tier. No surprise there.
One interesting question deep down in the report was whether a teacher had an identifying tracking number assigned (yes). Another was whether Missouri links teacher and student records by course/subject and assessment results (no). These questions were in between ones on teacher pay parity, mentor teachers and other traditional teacher quality questions. Mmm....
❝The day is not far off, teacher-quality advocates say, when a host of professional and policy decisions could be informed by analysis of data from thousands of teachers and students observed over time. Such longitudinal data allow researchers to measure changes in student achievement—and to link them with teacher characteristics.❞
Ah, a researcher's dream and a privacy advocate's nightmare.
❝For instance, teacher-preparation programs could be slated for overhauls—or not—depending on how well their graduates perform. Or state policies could reflect new knowledge about which qualifications indicate teacher effectiveness.❞
I already think teacher ed programs need overhauling, but research showing what works is always helpful.
❝While such systems have the potential to yield rich information on differences that affect student learning, they also raise a thorny question: Might teachers be ranked, assigned, or fired on the basis of such data?❞
The idea is to focus on student achievement instead of teachers, but in this day of accountability I don't believe that would really happen. As a researcher wanna-be, though, I see so much potential...
Can I have my kid's score, please?

Last semester I had a student tell me about the sneaky way she had to use to find out her child's reading level. I was appalled. I never asked which district and don't want to know. My kids' teachers have told me the reading scores at conferences, which I had assumed every teacher in the country did. I was disappointed to find out I was wrong.
Jay Mathews lists parent participation as a way to improve schools. Participation can mean fundraising for the PTO, showing up for teacher conferences, helping in the classroom or even having a voice in school policies. If parents aren't even given their own child's assessments and standardized test results, then any talk about increasing participation is just so much fluff, happy talk, can-we-get-some-money-out-of-you talk.
If I had more time, I would survey the local districts for participation rates (using multiple methods of participating) and see which factors had the highest correlation rate. My guess would be education level, more so than median income. Secondary factors might include size of district and transportation method.
A theory of mine is that schools that don't provide bus service would have higher parent participation. They already have to walk or drive the kids to school. Double points for the schools that don't have efficient carpool lanes. The parents might actually have to go inside to pick up the kids and see the teachers. Find me one of those schools that doesn't have high parental partnership.
Parents that want to know how to become more involved or help their school become more open can be inspired by St. Louis's own Project Appleseed, a national resource for improving parental involvement. Actually, it has a lot of good information for educators also.
Schools usually include in their mission statements about the importance of parent participation. I want to see them walk it, which includes the first steps of thinking of parents as partners and providing them with all testing and assessment results, not just when the parents ask for it.
Do we read or not?
Now we're ranked the sixth most literate city, especially because of our great library resources.
❝St. Louis measured high in library resources — second only to Columbus, Ohio — which remained "outstanding," McLaughlin said.❞
A few days ago I posted that St. Louis was ranked the 9th best place to educate our kids by Forbes. Ironically, our lowest score was for our library system. C+ Sigh, I think I have a headache.
One difference between the two is that the Central Connecticut State University library study just looked at St. Louis city; whereas, the Forbes report looked at the entire metropolitan area.
The CCSU study looked at:
1. Number of school media personnel per 1,000 public school student
2. Number of branch libraries per 10,000 library service population
3. Volumes held in the library per capita of library service population
4. Number of circulations per capita of library service population
5. Number of library professional staff per 10,000 library service population
I couldn't find the specific methodology for the places ranked (Forbes) study, but it discussed number of volumes and turnover. It looks like the CCSU study looks at a wider variety of factors by adding in accessibility and number of librarians. Whether it is the accessibility or narrowing the scope to the city that made the library system higher ranked would be interesting to know.
This is another example of seemingly conflicting assessments that could confuse the public. However, I guess most people who actually read the articles just remember the rankings and leave it at that. Maybe I'm the only one who gets confused.
But hey, we're No. 6!
We're a great place to educate our kids, so sayeth Forbes

Unlike CQ Press's crime statistics, Forbes seems to realize that St. Louis is more than just the city. In ranking the St. Louis area #9 for best places for education, David Savageau has looked at the entire metropolitan area.
Grades
Public School Support A
Private School Options A+
Library Popularity C+
College Town B+
College Options A+
I find the lower grade for library popularity intriguing as I've always heard St. Louis had a strong library system. I'll have to look into this further. Where are the weak links? I don't have time this Christmas vacation to do much digging as I am busy catching up with my reading and paying those library fines.
It's Report Card time!
I am sure I will be mining these report cards for data for some time, but for today's sneak preview I thought I would provide a chart listing the St. Louis county districts by median income and then whether or not they met the criteria for this "award." It's quite telling I think.