Missouri beats Lithuania by one—in math

photo by apesara
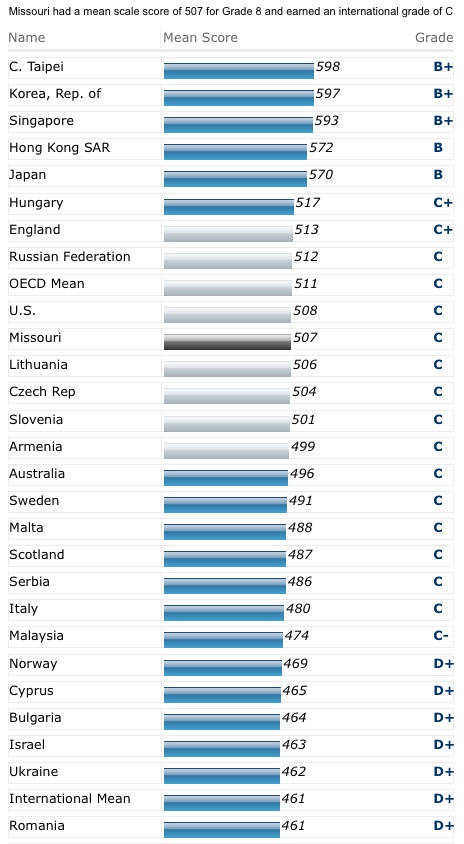
Last fall, I blogged about the importance of comparing our students not just to other students locally or to other states but internationally. Ideally, we would have information for individual districts, but until we do, the American Institutes for Research has released a report that allows you to compare individual states with other countries. Missouri, not surprisingly, is right at the U.S. median for both fourth and eighth grade math scores.
At the fourth grade level only six states received a B; by eighth grade only Massachusetts received a B.
“These Asian nations consistently perform at the B+, B, and B- levels,” Phillips [acting commissioner of the National Center for Education Statistics from 1999 to 2002] said. “Their students are learning mathematics not just at a higher level than students in the United States, but at a level that is a quantum leap higher.” The math proficiency average for U.S. students is C+ in grade 4 and C at grade 8. (AIR news release 16 June 2009)
Since Missouri is right behind the U.S. average, we are not competing well against Asian students.
“Our states and school districts should no longer be comparing themselves to their neighbors. They will be competing for jobs and innovations with students around the globe.” (AIR news release 16 June 2009)
I’ve said that before.
our states and school districts fall comparatively further behind in Grade 8 than they do in Grade 4. Although the United States falls further behind in the higher grade, the highest achieving countries maintain their level of performance. AIRInternationalBenchmarks2009
The middle school problem is real in the United States and, apparently, Missouri also. As a culture we are more concerned about their social lives than their academic abilities. Our expectations are not high-- “They can’t think clearly with all those hormones!” --but they obviously work hard in other countries. I would love to see if any of our middle schools are bucking this trend.
Here is the chart showing where Missouri places compared to other countries for eighth grade math. The grey bars are for countries with scores that are considered statistically similar. The interactive chart is fascinating to play with. I eagerly await the time when we can put individual school districts in for comparison.
Missouri top schools in math

Photo by Fábio Pinheiro
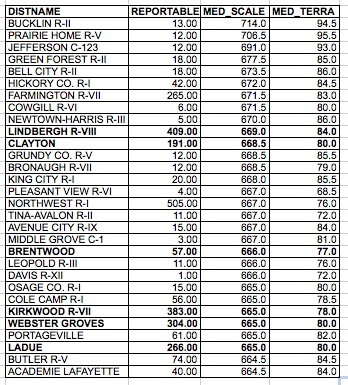
As part of my mission to widen the focus from St. Louis area to at least the state, I looked at the top school districts in Missouri in math in fourth grade and tenth grade. I chose fourth grade to give students the first year of testing to get used to taking standardized exams. I chose tenth grade as the highest grade of testing to look at the overall or “final” results of the district’s teaching. I looked at the median scale score instead of the number of proficient and advanced as I felt it was more representative of the spectrum of abilities including the advanced students. Also, this would discourage districts from overfocusing on the “bubble” students and, instead, work with each one equally. The median is more representative than mean as it is less affected by a student who fills in bubbles in cute patterns or one or two 0 scores. Many of the top school districts have grade levels that are quite small, so I included the numbers for perspective. I also included the median Terra Nova score to provide some national comparison and a frame of reference for the MAP scale score.
Missouri top 30 school districts 4th grade math
Missouri top 40 school districts 10th grade math
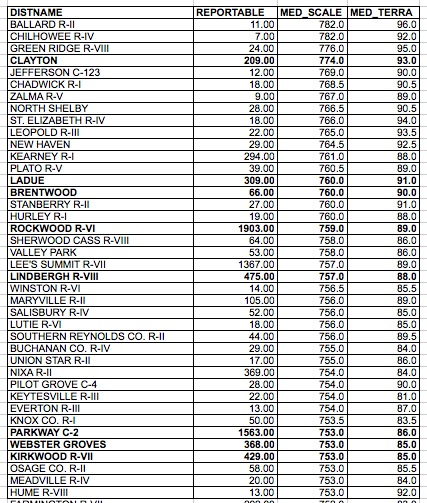
I dipped down to the top 40 (41) instead of the top 30 for the 10th grade math to pick up three more St. Louis County school districts.
To me it’s clear that while St. Louis County schools are strong, they have some competition in the state that should be acknowledged.
What about the students outside St. Louis?

Photo by Hira3
Local school districts like to tout their rankings in MAP scores as a way to demonstrate quality. “We’re #1 in St. Louis in this particular grade in a math scores at this elementary school. Yay us!” While districts do have some reasons to compare themselves to other districts within the metropolitan area, they do need to realize the limitations.
After listening to a district list its MAP score rankings within St. Louis at a parent meeting, a friend complained to me about the “provincial” thinking. “These kids compete for college with students across the country, not just from St. Louis.” Friends of mine who are from other cities don’t understand our emphasis on competing against only local schools.
I’ll start by trying to focus less on St. Louis-only comparisons and incude more state comparisons when discussing MAP scores. I’ll also try to compare across state lines and international when possible. If I want districts to broaden their outlook, I should start by doing so here.
Hospitals, school districts benefit from open data

Driving home the other day I heard a discussion on NPR Talk of the Nation about putting hospital statistics online so people can compare them. I immediately thought that if one substituted the word schools for hospitals the discussion would be the same.
Challenges of comparing high-risk patients to low-risk patients. Check.
Hospitals not being eager to provide data. Check.
Benefits of openness and transparency. Check.
Need to put checks in to prevent hospitals from gaming the system. Check.
The show concluded by the experts agreeing that this is an important but still small first step in accountability, openness and transparency. The biggest benefit comes not from patients being able to compare hospitals but from hospitals sending staff to high-scoring ones to learn from them.
In that spirit, if I were a superintendent in the St. Louis metropolitan area, I would send someone to Fox to find out why they have the highest percentage of free and reduced lunch students in the St. Louis area scoring at proficient or advanced in both math and communications MAP scores.
I chose this picture because I liked it and Children’s is, unfortunately, the hospital I have used the most often as I have three children. The website focuses on acute care and doesn’t include pediatric hospitals like Children’s or Cardinal Glennon even though it has a section for children’s asthma.
Moneyball

I know that everyone on the East Coast is hyperfocusing on the Superbowl, which I'll watch, but, really, I'm just counting the days to spring training.
In fact, baseball and education are amazingly similar.
❝He [Joe Maddon, Tampa Bay] knows human factors affect the numbers radically. Context is partially external (in baseball, factors like ball park effects, weather, a humidor or not) but it's vastly internal (human players as individuals and as part of the team and their individual quirks and personal strengths and weaknesse
He knows the numbers only take you so far and that you have to go farther than that to achieve excellence. Maddon doesn't lose sight of the vast pool of non-numeric data out there...that goes into his pool from which to draw❞ (Management by Baseball)
Tony LaRussa, while not exactly a Moneyball proponent, gives a great quote.
❝The 'Moneyball' kind of stuff has its place, but so does the human," La Russa said by telephone from Pittsburgh. "Really, the combination is the answer.❞
As teachers, principals, administrators, researchers and policy wonks, we all need to remember that data can help us improve education without being so data-driven as to lose sight of good teaching.
Can data improve my teaching?

I did my first formal CAT yesterday. I've added a new assignment this semester (group wiki), so I asked them to write down strengths and areas to improve on the assignment. We then discussed it, and I told them my ideas for improvement also. I use this in conjunction with their final products to help me improve my teaching for next semester or possibly future assignments if applicable.
That is my background on assessment.
I've enjoyed reading Eduwonkette's week on data-driven posts and appreciated the link to Scott McLeod's data resource page where I found an article that made the parent side of me salivate.
❝Stage-three schools shift the focus from groups to individual students — every single, individual student.❞
McIntire discusses how schools can say that they focus on all students but most don't have the systems in place to do so. I've had friends whose districts say they differentiate, but they don't feel the district follows that mission statement at all.
Differentiating is the buzzword right now, but it is hard to implement without support.
❝In stage-three schools, school leaders establish structures of accountability that ensure teachers regularly analyze student performance data, talk about it in functional units, and enact specific action plans at the classroom, team, grade, and school level.❞
Of course to do that requires time for teachers to meet together in teams, which they should be doing anyway.
❝How can teachers hope to provide customized instruction to dozens or even hundreds of students?❞
But they can, and do. I've seen it.
Using data to improve instruction shouldn't be overrelied on but if used with commonsense can help more kids learn. Off to read Datawise now.
Data Mining

The Quality Counts 2008 Report is out, and Missouri didn't finish in the top tier. No surprise there.
One interesting question deep down in the report was whether a teacher had an identifying tracking number assigned (yes). Another was whether Missouri links teacher and student records by course/subject and assessment results (no). These questions were in between ones on teacher pay parity, mentor teachers and other traditional teacher quality questions. Mmm....
❝The day is not far off, teacher-quality advocates say, when a host of professional and policy decisions could be informed by analysis of data from thousands of teachers and students observed over time. Such longitudinal data allow researchers to measure changes in student achievement—and to link them with teacher characteristics.❞
Ah, a researcher's dream and a privacy advocate's nightmare.
❝For instance, teacher-preparation programs could be slated for overhauls—or not—depending on how well their graduates perform. Or state policies could reflect new knowledge about which qualifications indicate teacher effectiveness.❞
I already think teacher ed programs need overhauling, but research showing what works is always helpful.
❝While such systems have the potential to yield rich information on differences that affect student learning, they also raise a thorny question: Might teachers be ranked, assigned, or fired on the basis of such data?❞
The idea is to focus on student achievement instead of teachers, but in this day of accountability I don't believe that would really happen. As a researcher wanna-be, though, I see so much potential...
Can I have my kid's score, please?

Last semester I had a student tell me about the sneaky way she had to use to find out her child's reading level. I was appalled. I never asked which district and don't want to know. My kids' teachers have told me the reading scores at conferences, which I had assumed every teacher in the country did. I was disappointed to find out I was wrong.
Jay Mathews lists parent participation as a way to improve schools. Participation can mean fundraising for the PTO, showing up for teacher conferences, helping in the classroom or even having a voice in school policies. If parents aren't even given their own child's assessments and standardized test results, then any talk about increasing participation is just so much fluff, happy talk, can-we-get-some-money-out-of-you talk.
If I had more time, I would survey the local districts for participation rates (using multiple methods of participating) and see which factors had the highest correlation rate. My guess would be education level, more so than median income. Secondary factors might include size of district and transportation method.
A theory of mine is that schools that don't provide bus service would have higher parent participation. They already have to walk or drive the kids to school. Double points for the schools that don't have efficient carpool lanes. The parents might actually have to go inside to pick up the kids and see the teachers. Find me one of those schools that doesn't have high parental partnership.
Parents that want to know how to become more involved or help their school become more open can be inspired by St. Louis's own Project Appleseed, a national resource for improving parental involvement. Actually, it has a lot of good information for educators also.
Schools usually include in their mission statements about the importance of parent participation. I want to see them walk it, which includes the first steps of thinking of parents as partners and providing them with all testing and assessment results, not just when the parents ask for it.
Do we read or not?
Now we're ranked the sixth most literate city, especially because of our great library resources.
❝St. Louis measured high in library resources — second only to Columbus, Ohio — which remained "outstanding," McLaughlin said.❞
A few days ago I posted that St. Louis was ranked the 9th best place to educate our kids by Forbes. Ironically, our lowest score was for our library system. C+ Sigh, I think I have a headache.
One difference between the two is that the Central Connecticut State University library study just looked at St. Louis city; whereas, the Forbes report looked at the entire metropolitan area.
The CCSU study looked at:
1. Number of school media personnel per 1,000 public school student
2. Number of branch libraries per 10,000 library service population
3. Volumes held in the library per capita of library service population
4. Number of circulations per capita of library service population
5. Number of library professional staff per 10,000 library service population
I couldn't find the specific methodology for the places ranked (Forbes) study, but it discussed number of volumes and turnover. It looks like the CCSU study looks at a wider variety of factors by adding in accessibility and number of librarians. Whether it is the accessibility or narrowing the scope to the city that made the library system higher ranked would be interesting to know.
This is another example of seemingly conflicting assessments that could confuse the public. However, I guess most people who actually read the articles just remember the rankings and leave it at that. Maybe I'm the only one who gets confused.
But hey, we're No. 6!
It's Report Card time!
I am sure I will be mining these report cards for data for some time, but for today's sneak preview I thought I would provide a chart listing the St. Louis county districts by median income and then whether or not they met the criteria for this "award." It's quite telling I think.